Detect threats using Microsoft Graph activity logs - Part 1
When working with Microsoft Entra there are many log sources you can use to detect usage and changes to the environment and the assets within it. Most of them can be forwarded using the diagnostic settings to different targets for better analysis capabilities or long term storage.
In many cases a Microsoft Sentinel or Log Analytics workspace is the target of choice, but also other SIEM solutions can benefit from this stream of log data.
While log categories like AuditLogs, SignInLogs are already used in many companies, sometime a new log is added to the list. For quite a long time there was one of high interest to many:
The “MicrosoftGraphActivityLogs”.
While for the same long time, enabling this log type did nothing in most environments, this changed a few days ago, when Microsoft announced the new logging capabilities.
I myself was in the lucky situation to be part of the private preview of this feature and want to share my insights on when this log can be useful and which use cases I already built.
In part one I focus on detecting reconnaissance tools in your environment. In part two I will go into more depth how you can use the now available information even more and how to correlate it with other datasets to gain deeper insights.
Threat hunting for reconnaissance
One use case that immediately came to mind was threat hunting. With such deep insights in the usage of Microsoft Graph, any action done by a threat actor can be tracked.
The next step was to identify public reconnaissance tools targeting Azure AD. This resulted in the following list of well known tools.
So my next step was to run all those tools against my Azure tenant and analyze the logs to identify patterns. The result of this step was, that I dismissed all tools expect AzureHound and Purple Knight for a deeper analysis. While Purple Knight requires the setup of a an app registration, an attacker could (ab)use any existing app registration with the correct permissions.
But one thing prevent further analysis of the other two.
Azure AD Graph
Ping Castle and AADInternals currently “evade” any detections because they don’t use the Microsoft Graph but the Azure AD Graph (graph.windows.net).
While being deprecated this API is still active and can be used without issue.
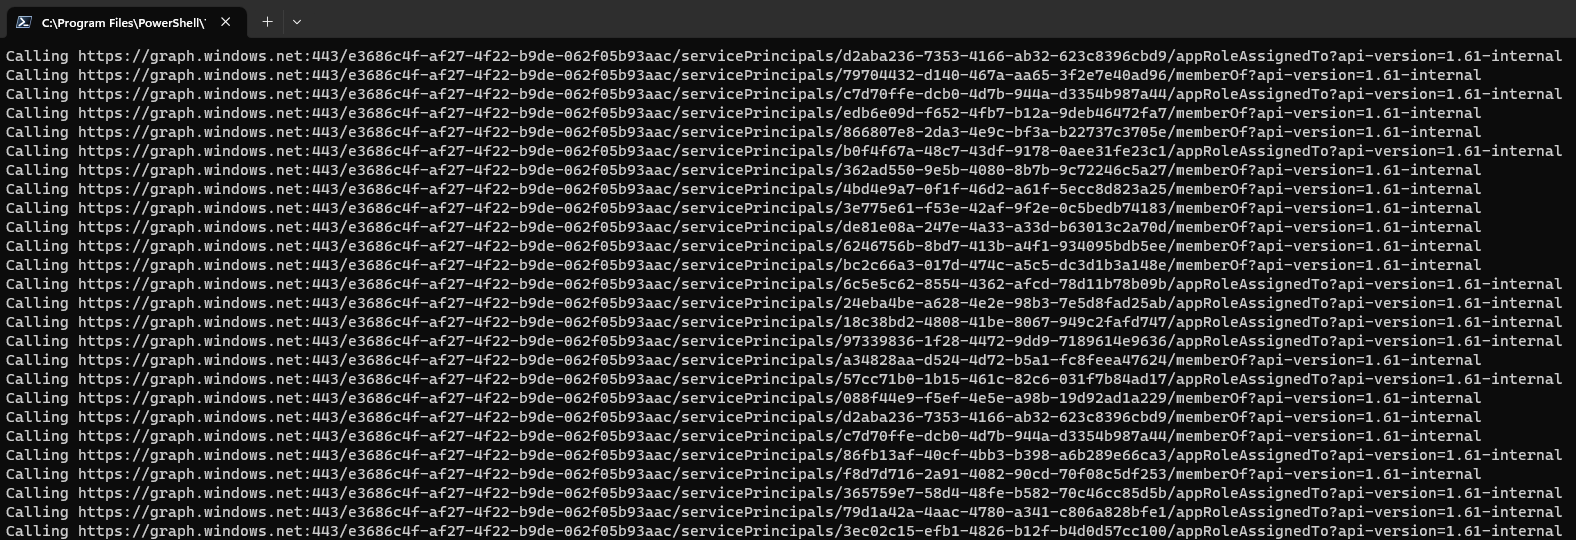
Until Microsoft does offer a way to turn off this API on a per tenant basis or is shutting it down completely, there is nothing you can do about that.
If you are interested in any changes in this area, this blog post from Microsoft is a good and up to date source of information.
AzureHound
My analysis of AzureHound (v2.1.0) was straight forward. I ran the tool in my environment using the pre built release on GitHub. I simulated a situation where the attacker would have gained the access token from a user and is trying to use this to dump all tenant information.
.\azurehound.exe list -t TENANTID -j $JWT -o tenant.json

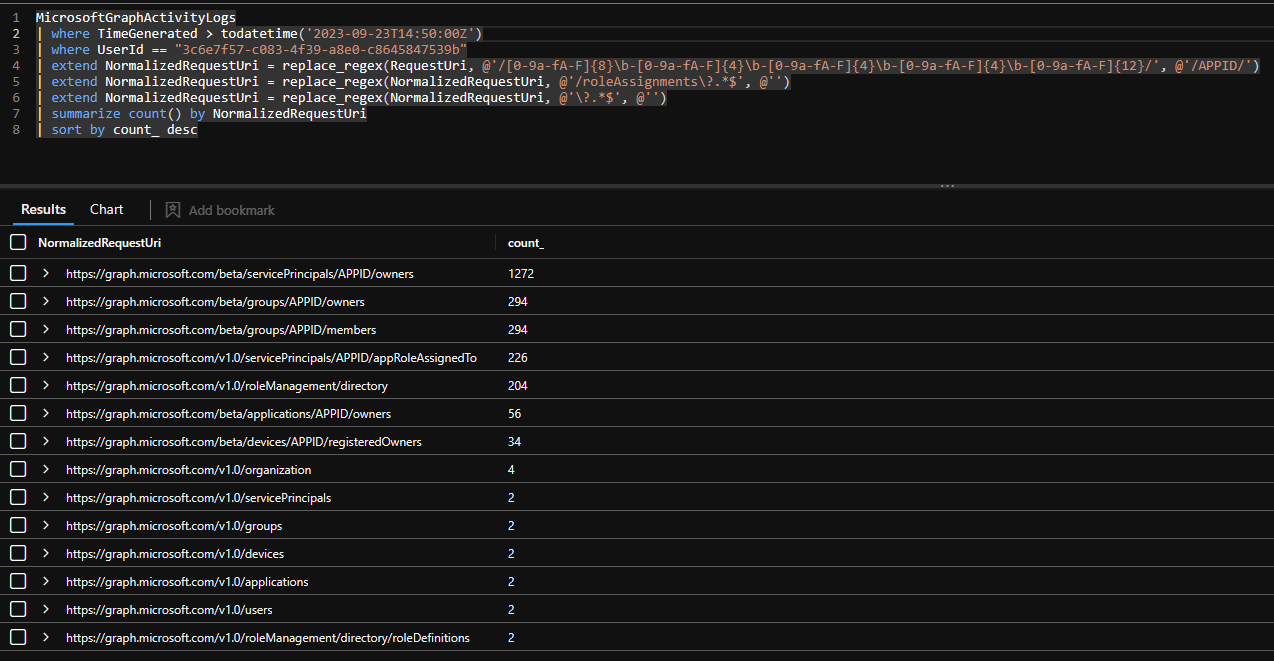
After a few minutes I used the MicrosoftGraphActivityLogs table in Sentinel to query all activity related to the user id after the time I ran the export.
Since most of the requested Graph endpoints had a minor difference, because e.g. service principals where requested, I added a bit of normalization to the RequestUri field.
This resulted in a list of 14 graph endpoints requested by AzureHound.
MicrosoftGraphActivityLogs
| where TimeGenerated > todatetime('2023-09-23T14:50:00Z')
| where UserId == "3c6e7f57-c083-4f39-a8e0-c8645847539b"
| extend NormalizedRequestUri = replace_regex(RequestUri, @'/[0-9a-fA-F]{8}\b-[0-9a-fA-F]{4}\b-[0-9a-fA-F]{4}\b-[0-9a-fA-F]{4}\b-[0-9a-fA-F]{12}/', @'/APPID/')
| extend NormalizedRequestUri = replace_regex(NormalizedRequestUri, @'/roleAssignments\?.*$', @'')
| extend NormalizedRequestUri = replace_regex(NormalizedRequestUri, @'\?.*$', @'')
| summarize count() by NormalizedRequestUri
| sort by count_ desc
You could now use all those endpoints and hunt for everybody accessing them in a short time frame. Of course all those endpoints might be a bit to exact, so I created a hunting query that will look back for 35 minutes and summarize all Graph endpoints called by objectId requesting them. Then I calculate a confidence score based on how many of the Graph endpoints in my defined list are called and if this score is above a certain threshold, will return more information.
let AzureHoundGraphQueries = dynamic([
    "https://graph.microsoft.com/beta/servicePrincipals/<UUID>/owners",
    "https://graph.microsoft.com/beta/groups/<UUID>/owners",
    "https://graph.microsoft.com/beta/groups/<UUID>/members",
    "https://graph.microsoft.com/v1.0/servicePrincipals/<UUID>/appRoleAssignedTo",
    "https://graph.microsoft.com/beta/applications/<UUID>/owners",
    "https://graph.microsoft.com/beta/devices/<UUID>/registeredOwners",
    "https://graph.microsoft.com/v1.0/users",
    "https://graph.microsoft.com/v1.0/applications",
    "https://graph.microsoft.com/v1.0/groups",
    "https://graph.microsoft.com/v1.0/roleManagement/directory/roleAssignments",
    "https://graph.microsoft.com/v1.0/roleManagement/directory/roleDefinitions",
    "https://graph.microsoft.com/v1.0/devices",
    "https://graph.microsoft.com/v1.0/organization",
    "https://graph.microsoft.com/v1.0/servicePrincipals"
    ]);
MicrosoftGraphActivityLogs
| where ingestion_time() > ago(35m)
| extend ObjectId = iff(isempty(UserId), ServicePrincipalId, UserId)
| extend ObjectType = iff(isempty(UserId), "ServicePrincipalId", "UserId")
| where RequestUri !has "microsoft.graph.delta"
| extend NormalizedRequestUri = replace_regex(RequestUri, @'[0-9a-fA-F]{8}\b-[0-9a-fA-F]{4}\b-[0-9a-fA-F]{4}\b-[0-9a-fA-F]{4}\b-[0-9a-fA-F]{12}', @'<UUID>')
| extend NormalizedRequestUri = replace_regex(NormalizedRequestUri, @'\?.*$', @'')
| summarize
    GraphEndpointsCalled = make_set(NormalizedRequestUri, 1000),
    IPAddresses = make_set(IpAddress)
    by ObjectId, ObjectType
| project
    ObjectId,
    ObjectType,
    IPAddresses,
    MatchingQueries=set_intersect(AzureHoundGraphQueries, GraphEndpointsCalled)
| extend ConfidenceScore = round(todouble(array_length(MatchingQueries)) / todouble(array_length(AzureHoundGraphQueries)), 1)
| where ConfidenceScore > 0.7
This query will show you all users that might be using AzureHound or a similar tool that requests at least 70% of the defined Graph endpoints in the query.
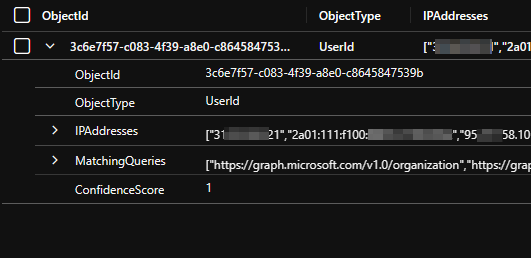
In addition to this information I looked for other indicators that could be used. One thing that immediately caught my eye was the user agent azurehound/v2.1.0.
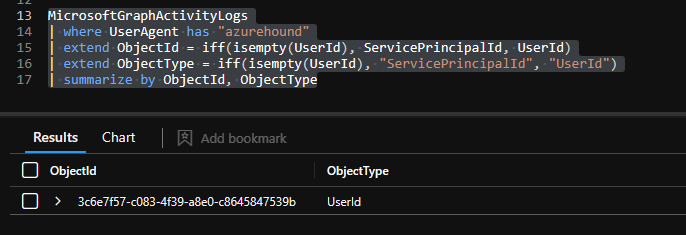
This makes it really easy to hunt for the usage of the pre-built AzureHound version.
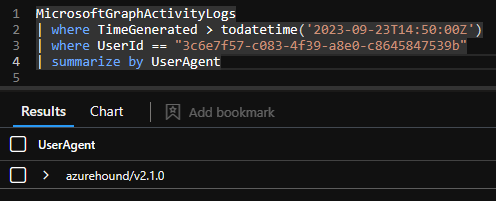
MicrosoftGraphActivityLogs
| where UserAgent has "azurehound"
| extend ObjectId = iff(isempty(UserId), ServicePrincipalId, UserId)
| extend ObjectType = iff(isempty(UserId), "ServicePrincipalId", "UserId")
| summarize by ObjectId, ObjectType
Purple Knight
For Purple Knight I used the same technique, but had to normalize a lot more of the endpoints, because UPNs where used instead of UUIDs. The result where a list of 23 Graph endpoints that are queried when running a full Purple Knight scan.
MicrosoftGraphActivityLogs
| where ServicePrincipalId == "362ad550-9e5b-4080-8b7b-9c72246c5a27"
| extend NormalizedRequestUri = replace_regex(RequestUri, @'[0-9a-fA-F]{8}\b-[0-9a-fA-F]{4}\b-[0-9a-fA-F]{4}\b-[0-9a-fA-F]{4}\b-[0-9a-fA-F]{12}', @'<UUID>')
| extend NormalizedRequestUri = replace_regex(NormalizedRequestUri, @'\d+$', @'<UUID>')
| extend NormalizedRequestUri = replace_regex(NormalizedRequestUri, @'\/+', @'/')
| extend NormalizedRequestUri = replace_regex(NormalizedRequestUri, @'\/(v1\.0|beta)\/', @'/version/')
| extend NormalizedRequestUri = replace_regex(NormalizedRequestUri, @'%23EXT%23', @'')
| extend NormalizedRequestUri = replace_regex(NormalizedRequestUri, @'\/[a-zA-Z0-9+_.\-]+@[a-zA-Z0-9.]+\/', @'/<UUID>/')
| extend NormalizedRequestUri = replace_regex(NormalizedRequestUri, @'^\/<UUID>', @'')
| extend NormalizedRequestUri = replace_regex(NormalizedRequestUri, @'\?.*$', @'')
| summarize count() by NormalizedRequestUri
| sort by count_ desc
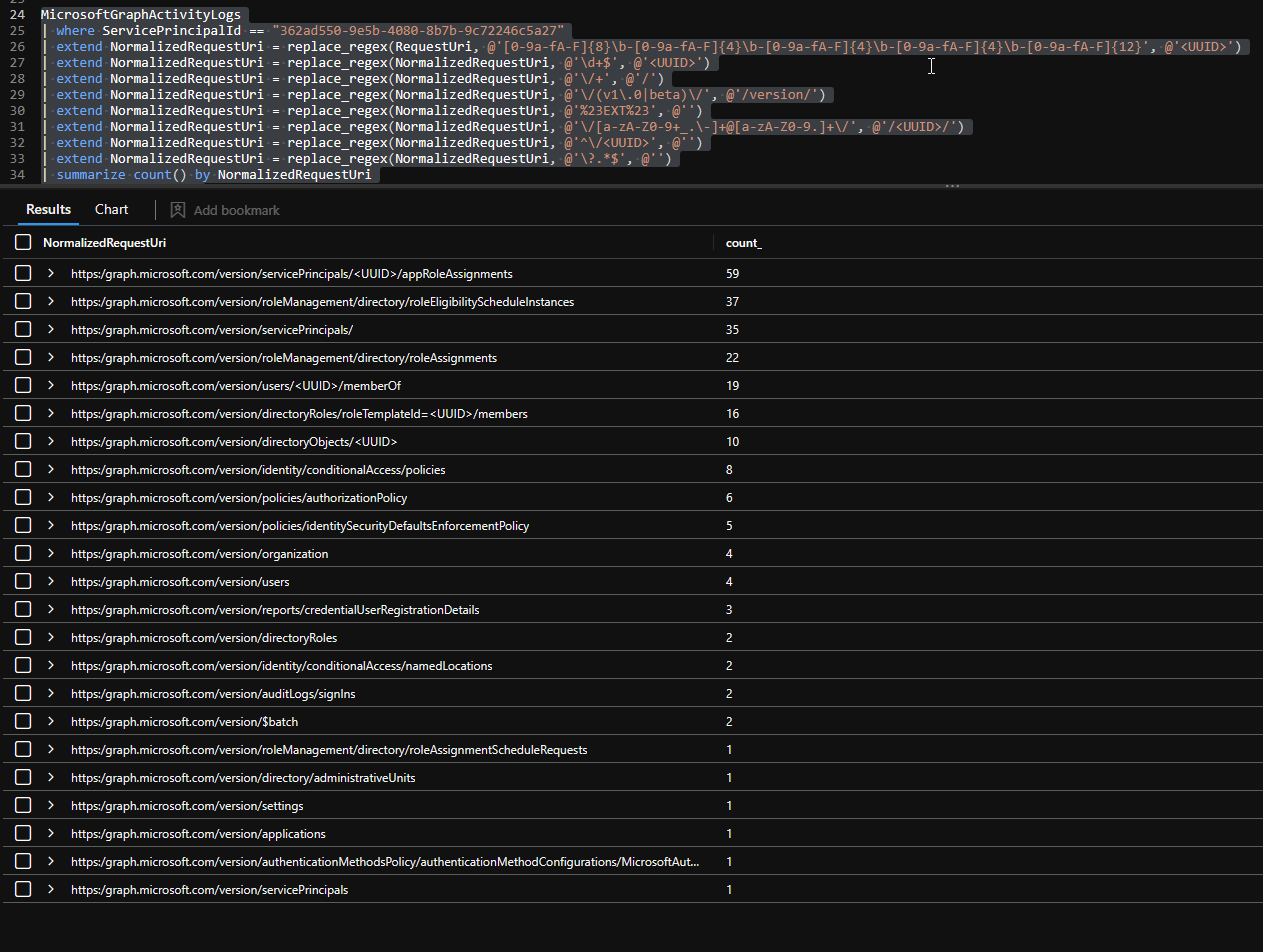
Using the same logic as described for AzureHound you can now detect the usage based on those Graph Endpoints.
In this case, the user agent was not as revealing as the one from AzureHound and would not be a great indicator on it’s own.

Microsoft Sentinel Analytics rules
As a result of this research I developed a few Analytics rules for Microsoft Sentinel that can be used to identify the usage of such tooling in your environment.
All of the Analytic Rules can be found in my public GitHub repository along other detections.
https://github.com/f-bader/AzSentinelQueries
AzureHound activity detected
This detection uses the near real-time detection capabilities of Microsoft Sentinel to raise an incident as soon as anybody in your tenant dares to use AzureHound. The detection is solely based on the UserAgent and can therefore easily bypassed, but for anybody using the precompiled version of AzureHound this will work just great.
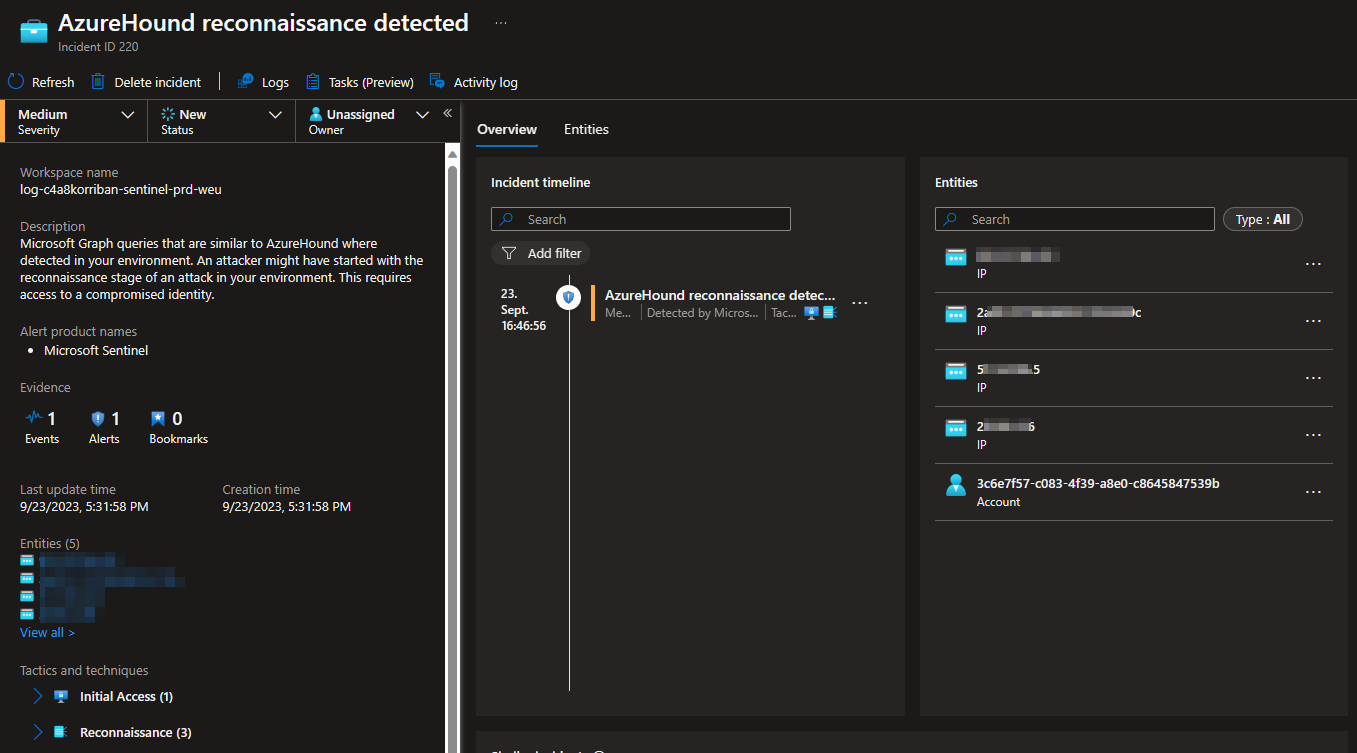
AzureHound reconnaissance detected
This detection is based on the confidence level approach explained earlier. The threshold is set to 70%.
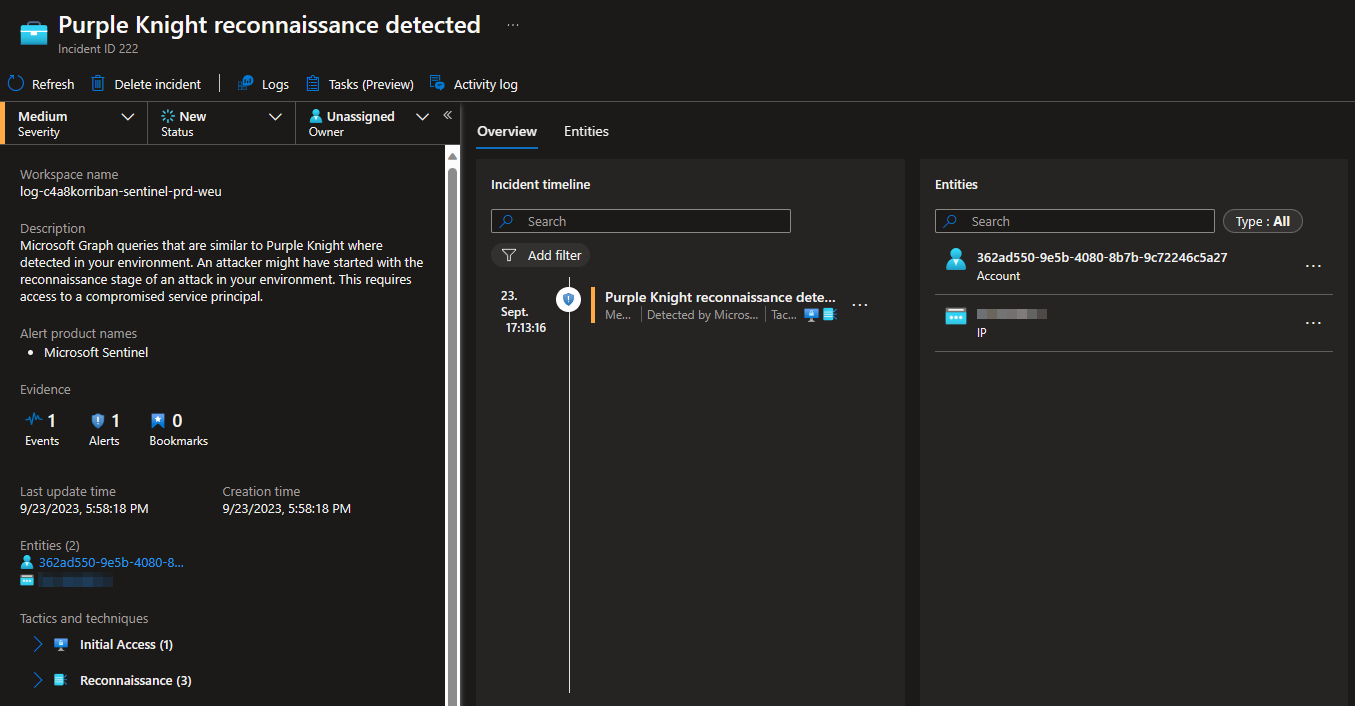
Purple Knight reconnaissance detected
Same as the AzureHound detection, but with the unique Graph endpoints of purple knight. The threshold is set to 70%.
Part two, coming soon
I already have plenty written for part two, but it needs a bit more polishing before I’m ready to share it. When all goes as planned come back in about two week for more information and use cases. In the meantime feel free to play with this yourself. Just make sure to test this in you lab environment first. As all Graph calls are logged, this can result in rather large ingestion cost.

